Problem
Classical allocation treats assets as independent columns in a returns matrix. But correlation structure is exactly that: structure. A graph is its natural representation. CGPO asks: if you hand a graph neural network the market's correlation graph, can a reinforcement-learning agent learn allocations that beat a benchmark? And can that live as an interactive system rather than a notebook?
Constraints
- One engineer, research timeline, and a public demo on a GPU, so every design choice had to keep the cost surface bounded.
- Allocations must be reproducible: the same market state should always produce the same weights, or no one can trust a comparison.
- The dashboard had to be gated, but the system explorable without a briefing.
Architecture
A Next.js client on Vercel talks to a FastAPI service on Modal with a T4 GPU. For a chosen asset universe, the backend pulls recent price history, computes per-asset features (return, volatility, momentum, RSI), and connects assets whose returns correlate. That graph feeds a GCN with a skip connection, whose per-asset scores become portfolio weights. An Advantage Actor-Critic agent is rewarded for excess return over the benchmark, with a volatility penalty discouraging erratic allocations. Trained weights persist to a Modal Volume, so the model survives the backend scaling to zero.
Decisions
- Deterministic readout at inference. Exploration belongs to training; serving is a pure function of market state. Same graph in, same weights out.
- Reward shaping over raw return. Optimizing raw return taught the agent to swing; excess-return-minus-volatility taught it to allocate.
- Scale-to-zero over always-on. A public GPU endpoint is a cost surface: inference is rate-limited per IP (60/min), training to 3 runs/hour, and the container spins down when idle.
- Persist the model, not the session. Cold starts reload weights from the Volume: restarts are invisible to users, and a trained model is never lost.
Outcomes
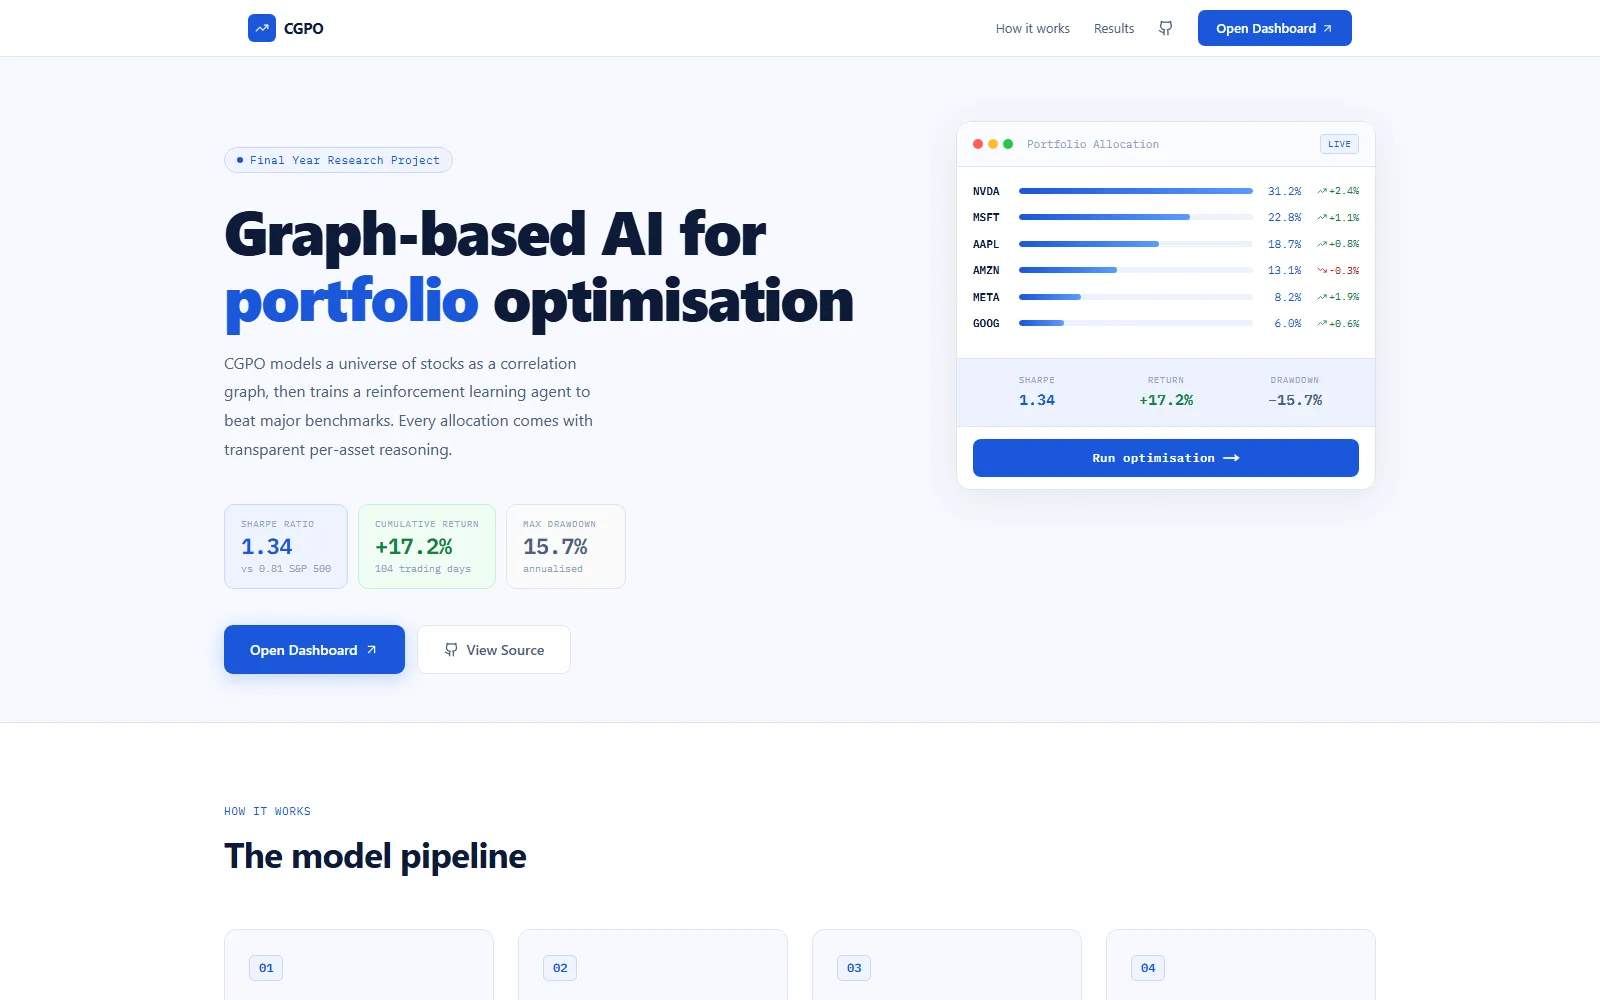
A live system anyone can sign into: pick a universe (Tech Giants, Finance, Healthcare, India Bluechips, or custom tickers), run inference, trigger a training run with live progress, and chart the portfolio against the S&P 500, Nasdaq 100, Dow Jones, Nifty 50, or Sensex across multiple time windows, with expected return, volatility, and Sharpe ratio surfaced next to plain-language reasoning for every allocation. The approach and results are written up in the accompanying research paper.